Stop the abuse
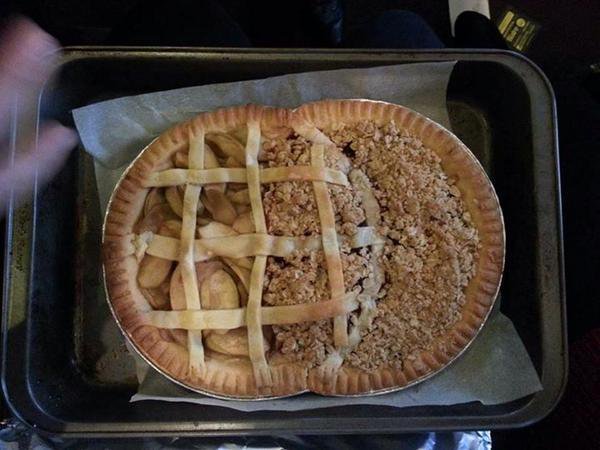
The 19th century philosopher and logician, John Venn, may be amused by the explosion of venn diagram applications in popular culture. There has been an explosion of social media memes and many are brilliant. I personally can’t go past the Venn Pieagram. Or this piece of venn diagram genius:

Love it.
But some of the worst offenders, the blatant mis-users of the venn diagram; exist in business, politics and media. And it has to stop. So, here is my rant.
Venn Diagram Basics:
Venn diagrams are circles, often overlapping; and they are used to show the relationship between two or more sets. They are the original infographic.
Venn Diagrams should be simple. They are aligned to how we think and help us make sense of potentially disparate ideas. They help us organise, find patterns and cut through chaos.
When used properly, a venn diagram has the power to make sense in a convoluted, disconnected sea of stuff.
Why Use Venn Diagrams?
You can add power to your message. A complex message can be expressed in the simplest of formats — a picture, where words are used sparingly.
Here are some of the benefits of the venn diagram:
- add impact to an association you have identified
- organise and clarify data sets and your interpretation of the overlap in those data sets
- aid understanding for you the presenter or writer
- aid understanding for your audience
- easy to create
- easy to read
The Senseless Misuse of Venn Diagrams
Here are some of the most heinous crimes:
- failing to identify the overlap- wrong
- listing mutually exclusive data in the various circles – wrong
- allowing the ‘smart art’ function in power-point to think for you – not so smart
- trying to illustrate connected components or links with multiple circles – confusing
- listing more things outside the circles because you have more to say and it doesn’t really fit in any of your circles – confusing and you need a different diagram
- failing to connect the circles – why bother?
Why do we get it wrong?
Well, visual storytelling is hard. Logic can be hard. It is difficult to say something new. It is challenging to tell a new story about information that is already available.
When we are in a rush, we need to produce a report or a presentation, we know we need to use images to enhance our message.
What can we do?
Draw your ideas.
Make a brain dump of all the data you need to communicate, in whatever format takes your fancy – post it notes, whiteboards, blank sheet of paper… Stand back and consider if you can create groups, then sub-groups. If so, what do they have in common? What separates them? Does it matter? Does it help you communicate your message?
Is the venn diagram the optimal tool for you to make sense of your observations for YOU and for your AUDIENCE?
Stop and think before you use the embedded tools in powerpoint or keynote. Consider first – what are you trying to say? Second – is there a visual representation that can tell my story more simply than just using words.
If so, away! Because when they are good they are very very good.
One last venn, just because:
Diagrams are a great way to support your presentation. Visual representation of a concept, when used correctly will help you crystallize your idea and help your audience understand your point. At mojologic we can help you with building a persuasive presentation, that is well planned, well supported and well delivered. Get in touch today.